Intermediate thickness: Peak fitting#
When the spectrum contains only few peaks, FFT method becomes less reliable. To determine the film thickness \(h\), we consider two scenarii : either the peak fitting is successful, or small fitting errors are present. Theoritical backgrounds of the two method are explain in an upcoming publication.
Scenario 1: Successful peak fitting#
Assuming the previous procedure has been followed and the resulting peak plot is as follows :
[1]:
from pathlib import Path
from optifik.io import load_spectrum
from optifik.analysis import plot_spectrum
from optifik.analysis import smooth_intensities
from optifik.analysis import finds_peak

# Define the path to the folder containing your .xy file
datafile_path = Path('../../data/basic/000004310.xy')
# Load wavelengths and intensities from the file
wavelengths, intensities = load_spectrum(datafile_path,
                                         wavelength_min=450,
                                         wavelength_max=800)

# Smoothing the intensity
intensities_smoothed = smooth_intensities(intensities)

# Peak detection function, min_peak_prominence and min_peak_distance can be adjusted.
peaks_min, peaks_max = finds_peak(wavelengths, intensities_smoothed,
                                   min_peak_prominence=0.018,
                                   min_peak_distance=10,
                                   plot=True)
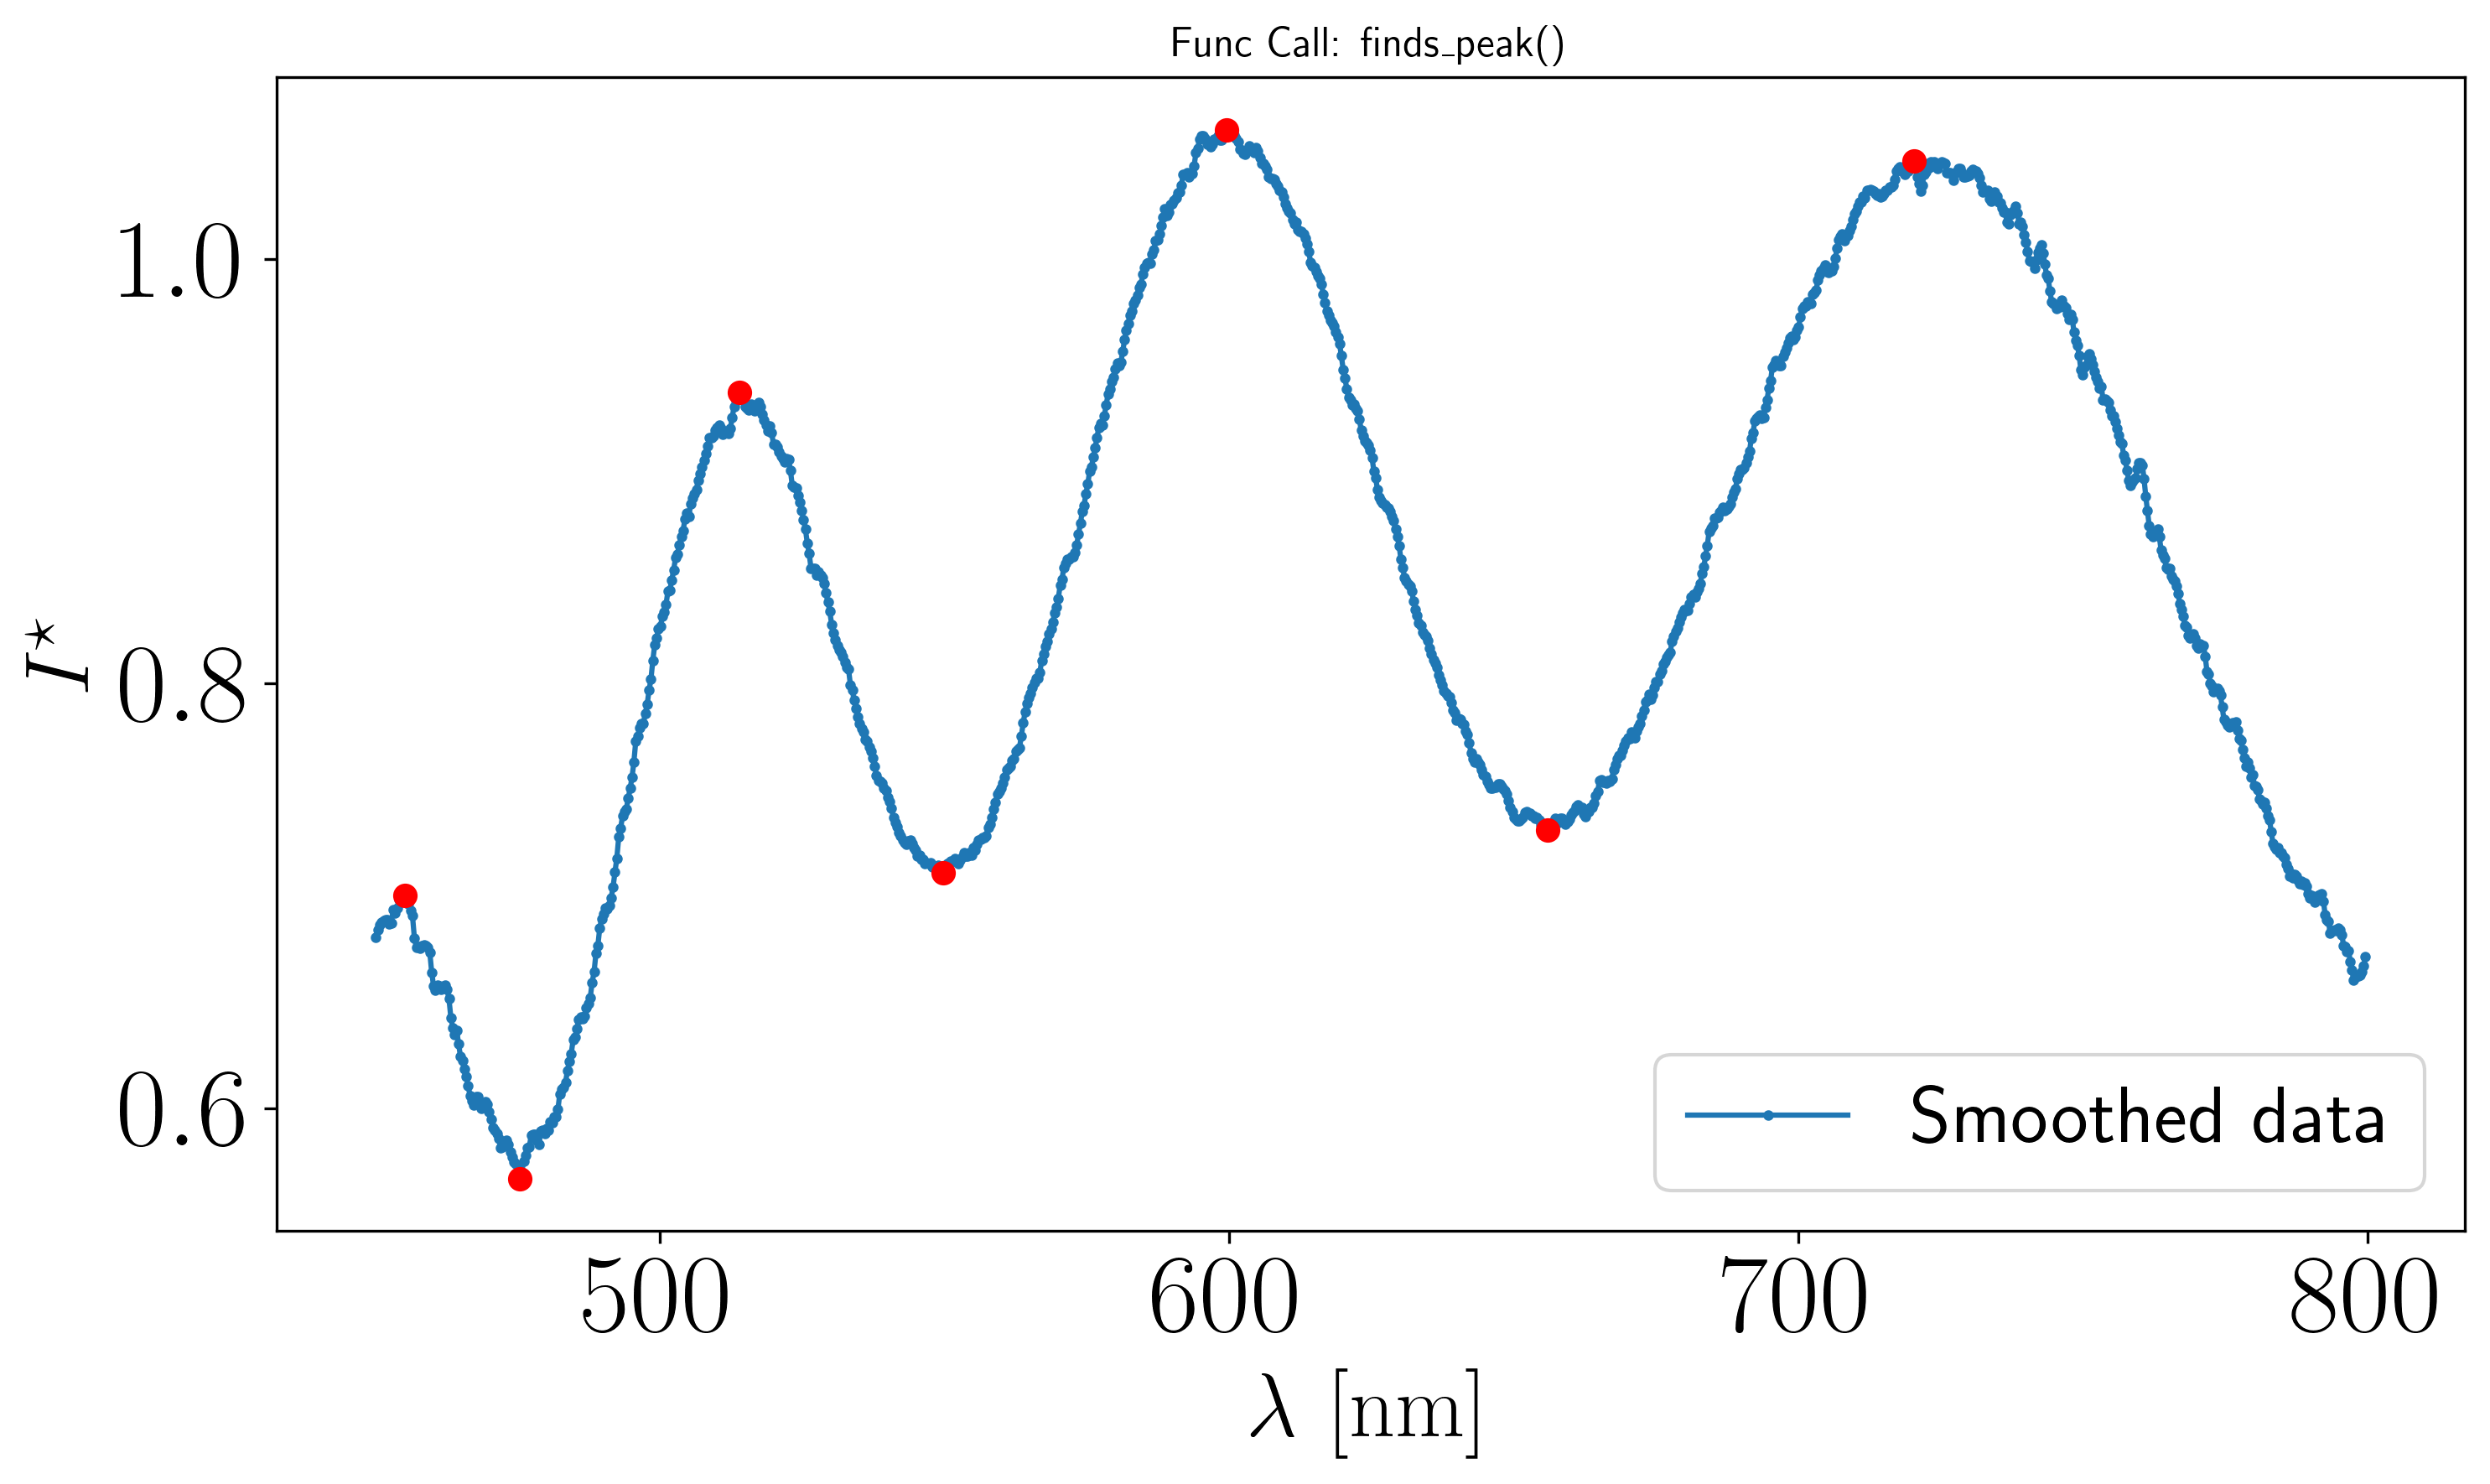
To derive the film thickness \(h\), we use the linear regression method method='linreg' of the thickness_from_minmax function from the optifik.minmax module. Here an exemple of plot you can obtain.
[2]:
from optifik.minmax import thickness_from_minmax

# Determine the film thickness by least squares linear regression
result = thickness_from_minmax(wavelengths, intensities_smoothed,
                              refractive_index=1.33,
                              min_peak_prominence=0.018,
                              min_peak_distance=10,
                              method='linreg',
                              plot=True)
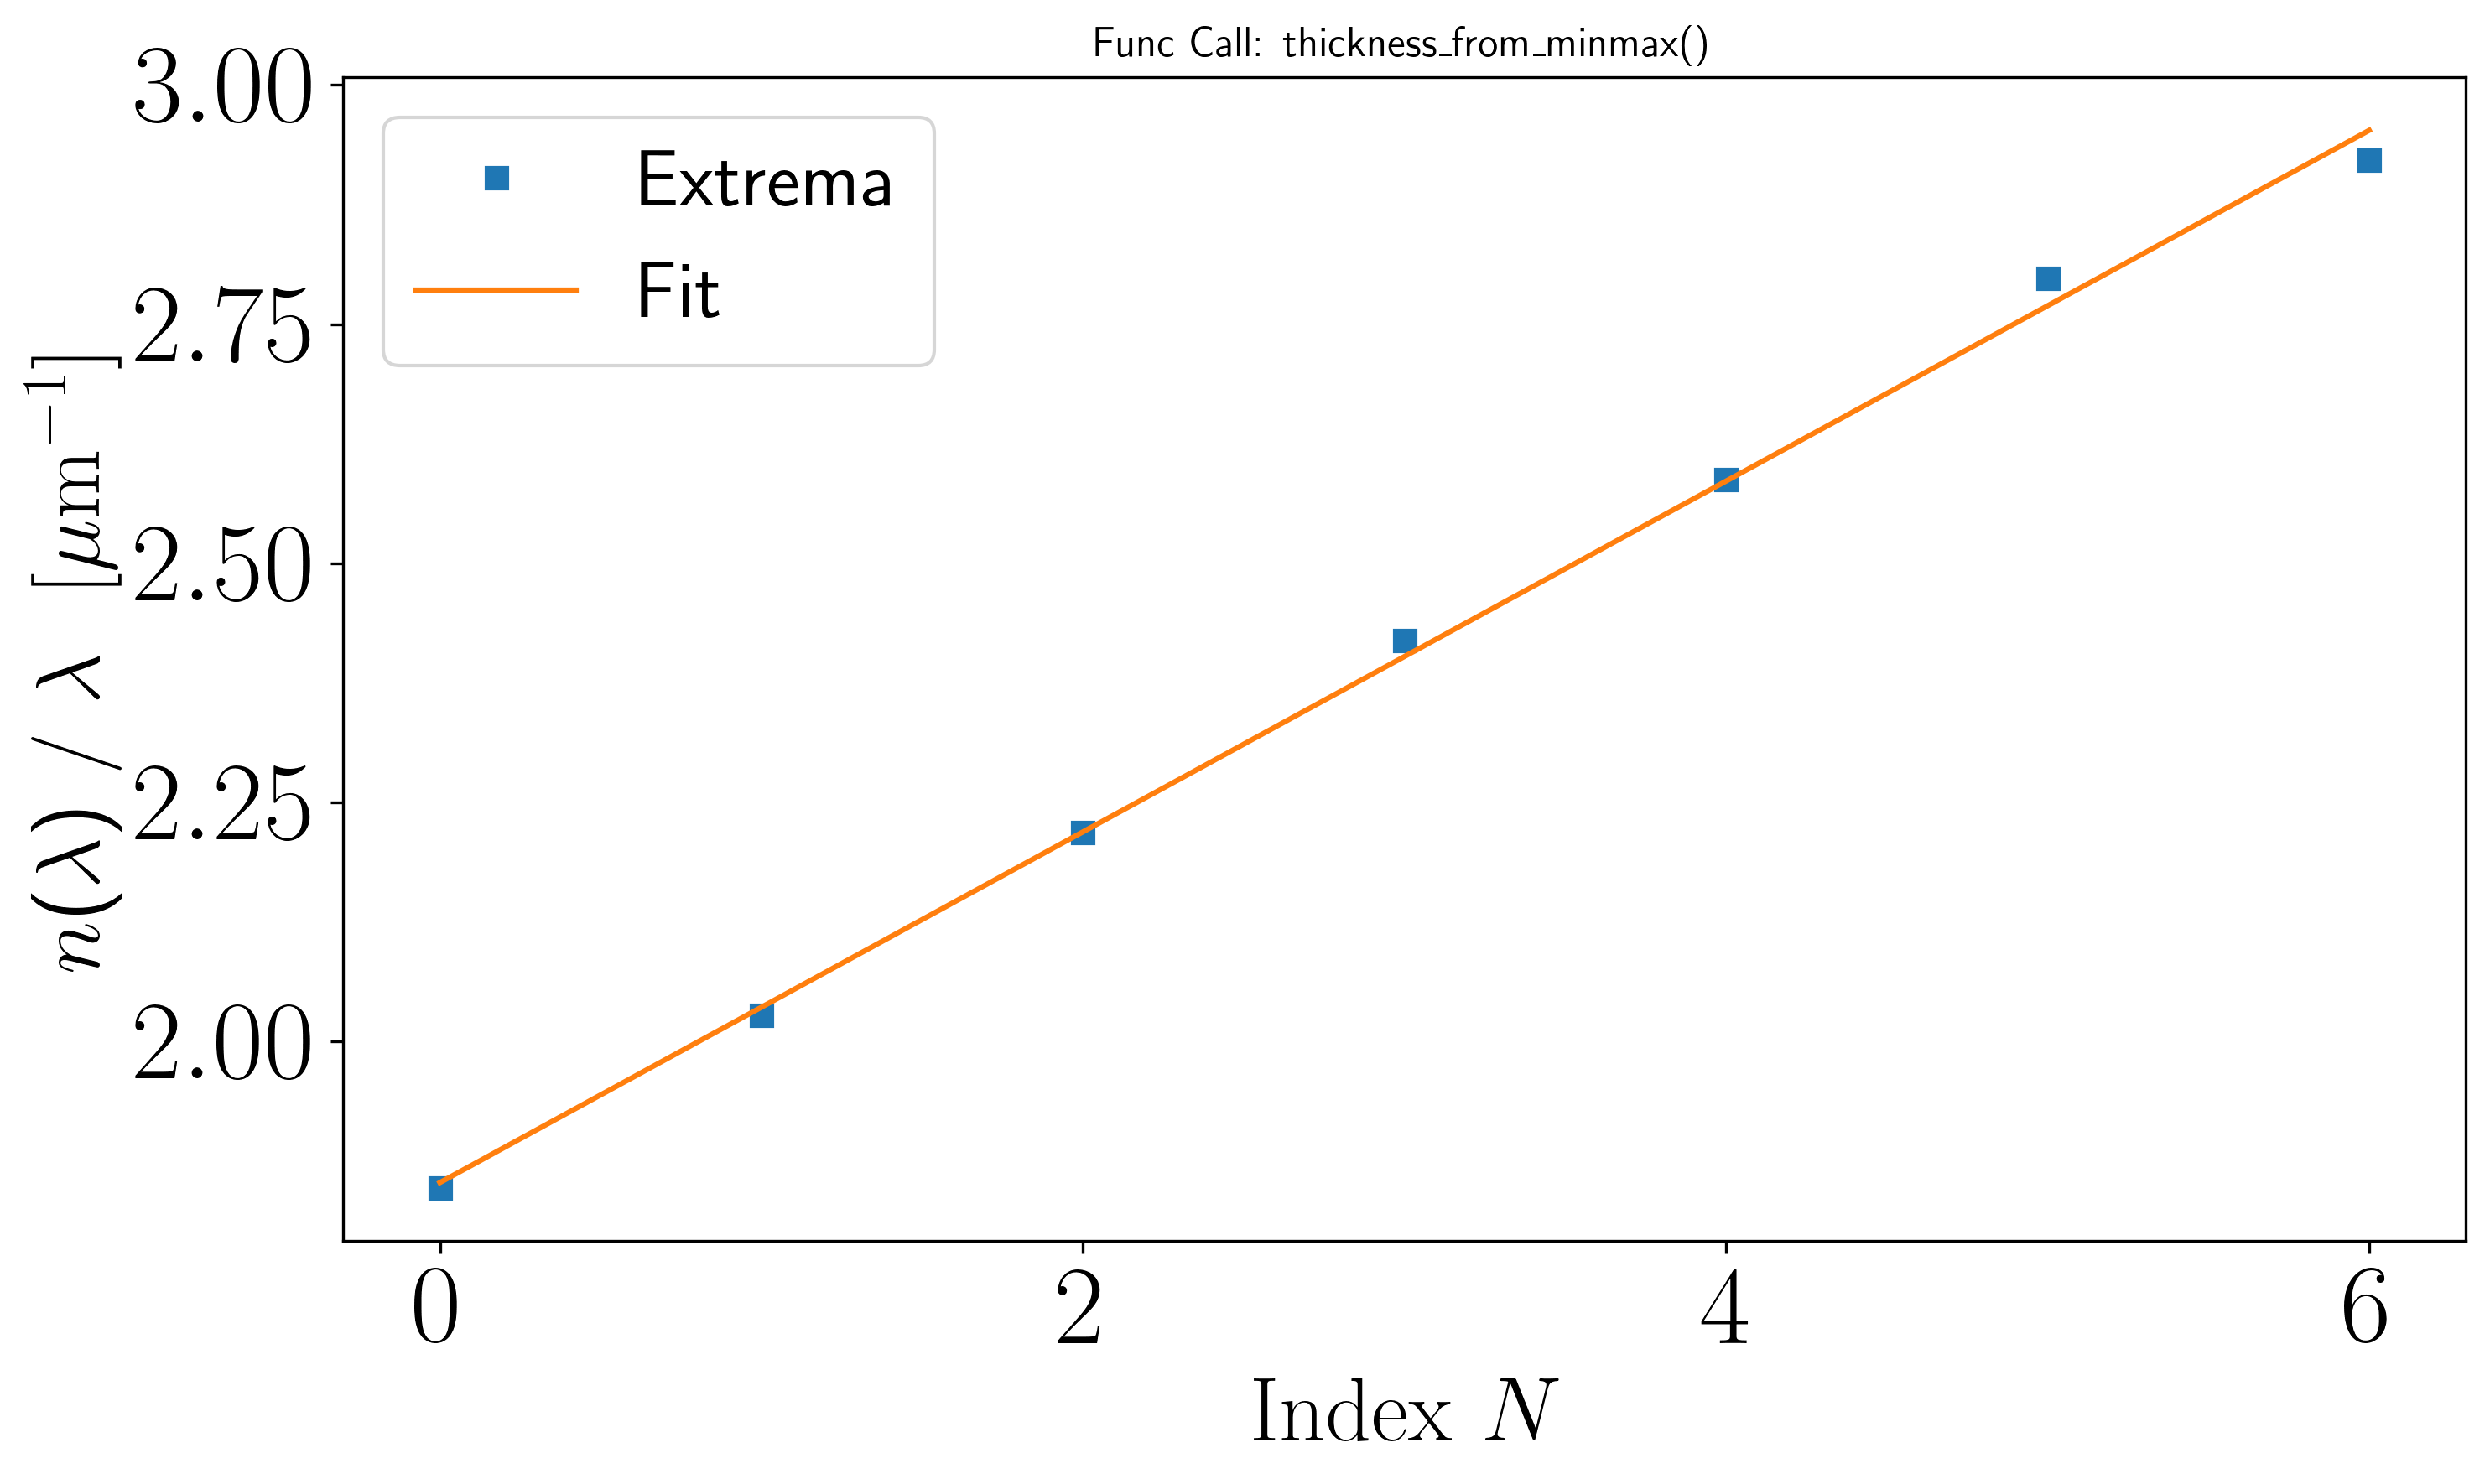
The least-squares regression method in the thickness_from_minmax function automatically determines the film thickness \(h\).
The console output shows the wavelength peak indices for minima and maxima, along with the standard deviation of the film thickness \(h\), which is 1363.25 nm in this example
The example correponds to the file
000004310.xy, located in the..\tests\basicfolderYou can specify the medium’s refractive index, the peak prominence and the minimum peak distance using the
refractive_index,min_peak_prominenceand themin_peak_distanceparameters, respectively.You can also provide a refractive index array \(n(\lambda)\) as an
refractive_indexinput.
Scenario 2: Small errors detection#
Assuming the previous procedure has been followed and the resulting peak plot is as follows :
[3]:
from pathlib import Path
from optifik.io import load_spectrum
from optifik.analysis import plot_spectrum
from optifik.analysis import smooth_intensities
from optifik.analysis import finds_peak

# Define the path to the folder containing your .xy file
datafile_path = Path('../../data/basic/Fail_000004168.xy')

# Load wavelengths and intensities from the file
wavelengths, intensities = load_spectrum(datafile_path,
                                         wavelength_min=450,
                                         wavelength_max=800)

# Smoothing the intensity
intensities_smoothed = smooth_intensities(intensities)

# Peak detection function, min_peak_prominence and min_peak_distance can be adjusted.
peaks_min, peaks_max = finds_peak(wavelengths, intensities_smoothed,
                                   min_peak_prominence=0.018,
                                   min_peak_distance=10,
                                   plot=True)
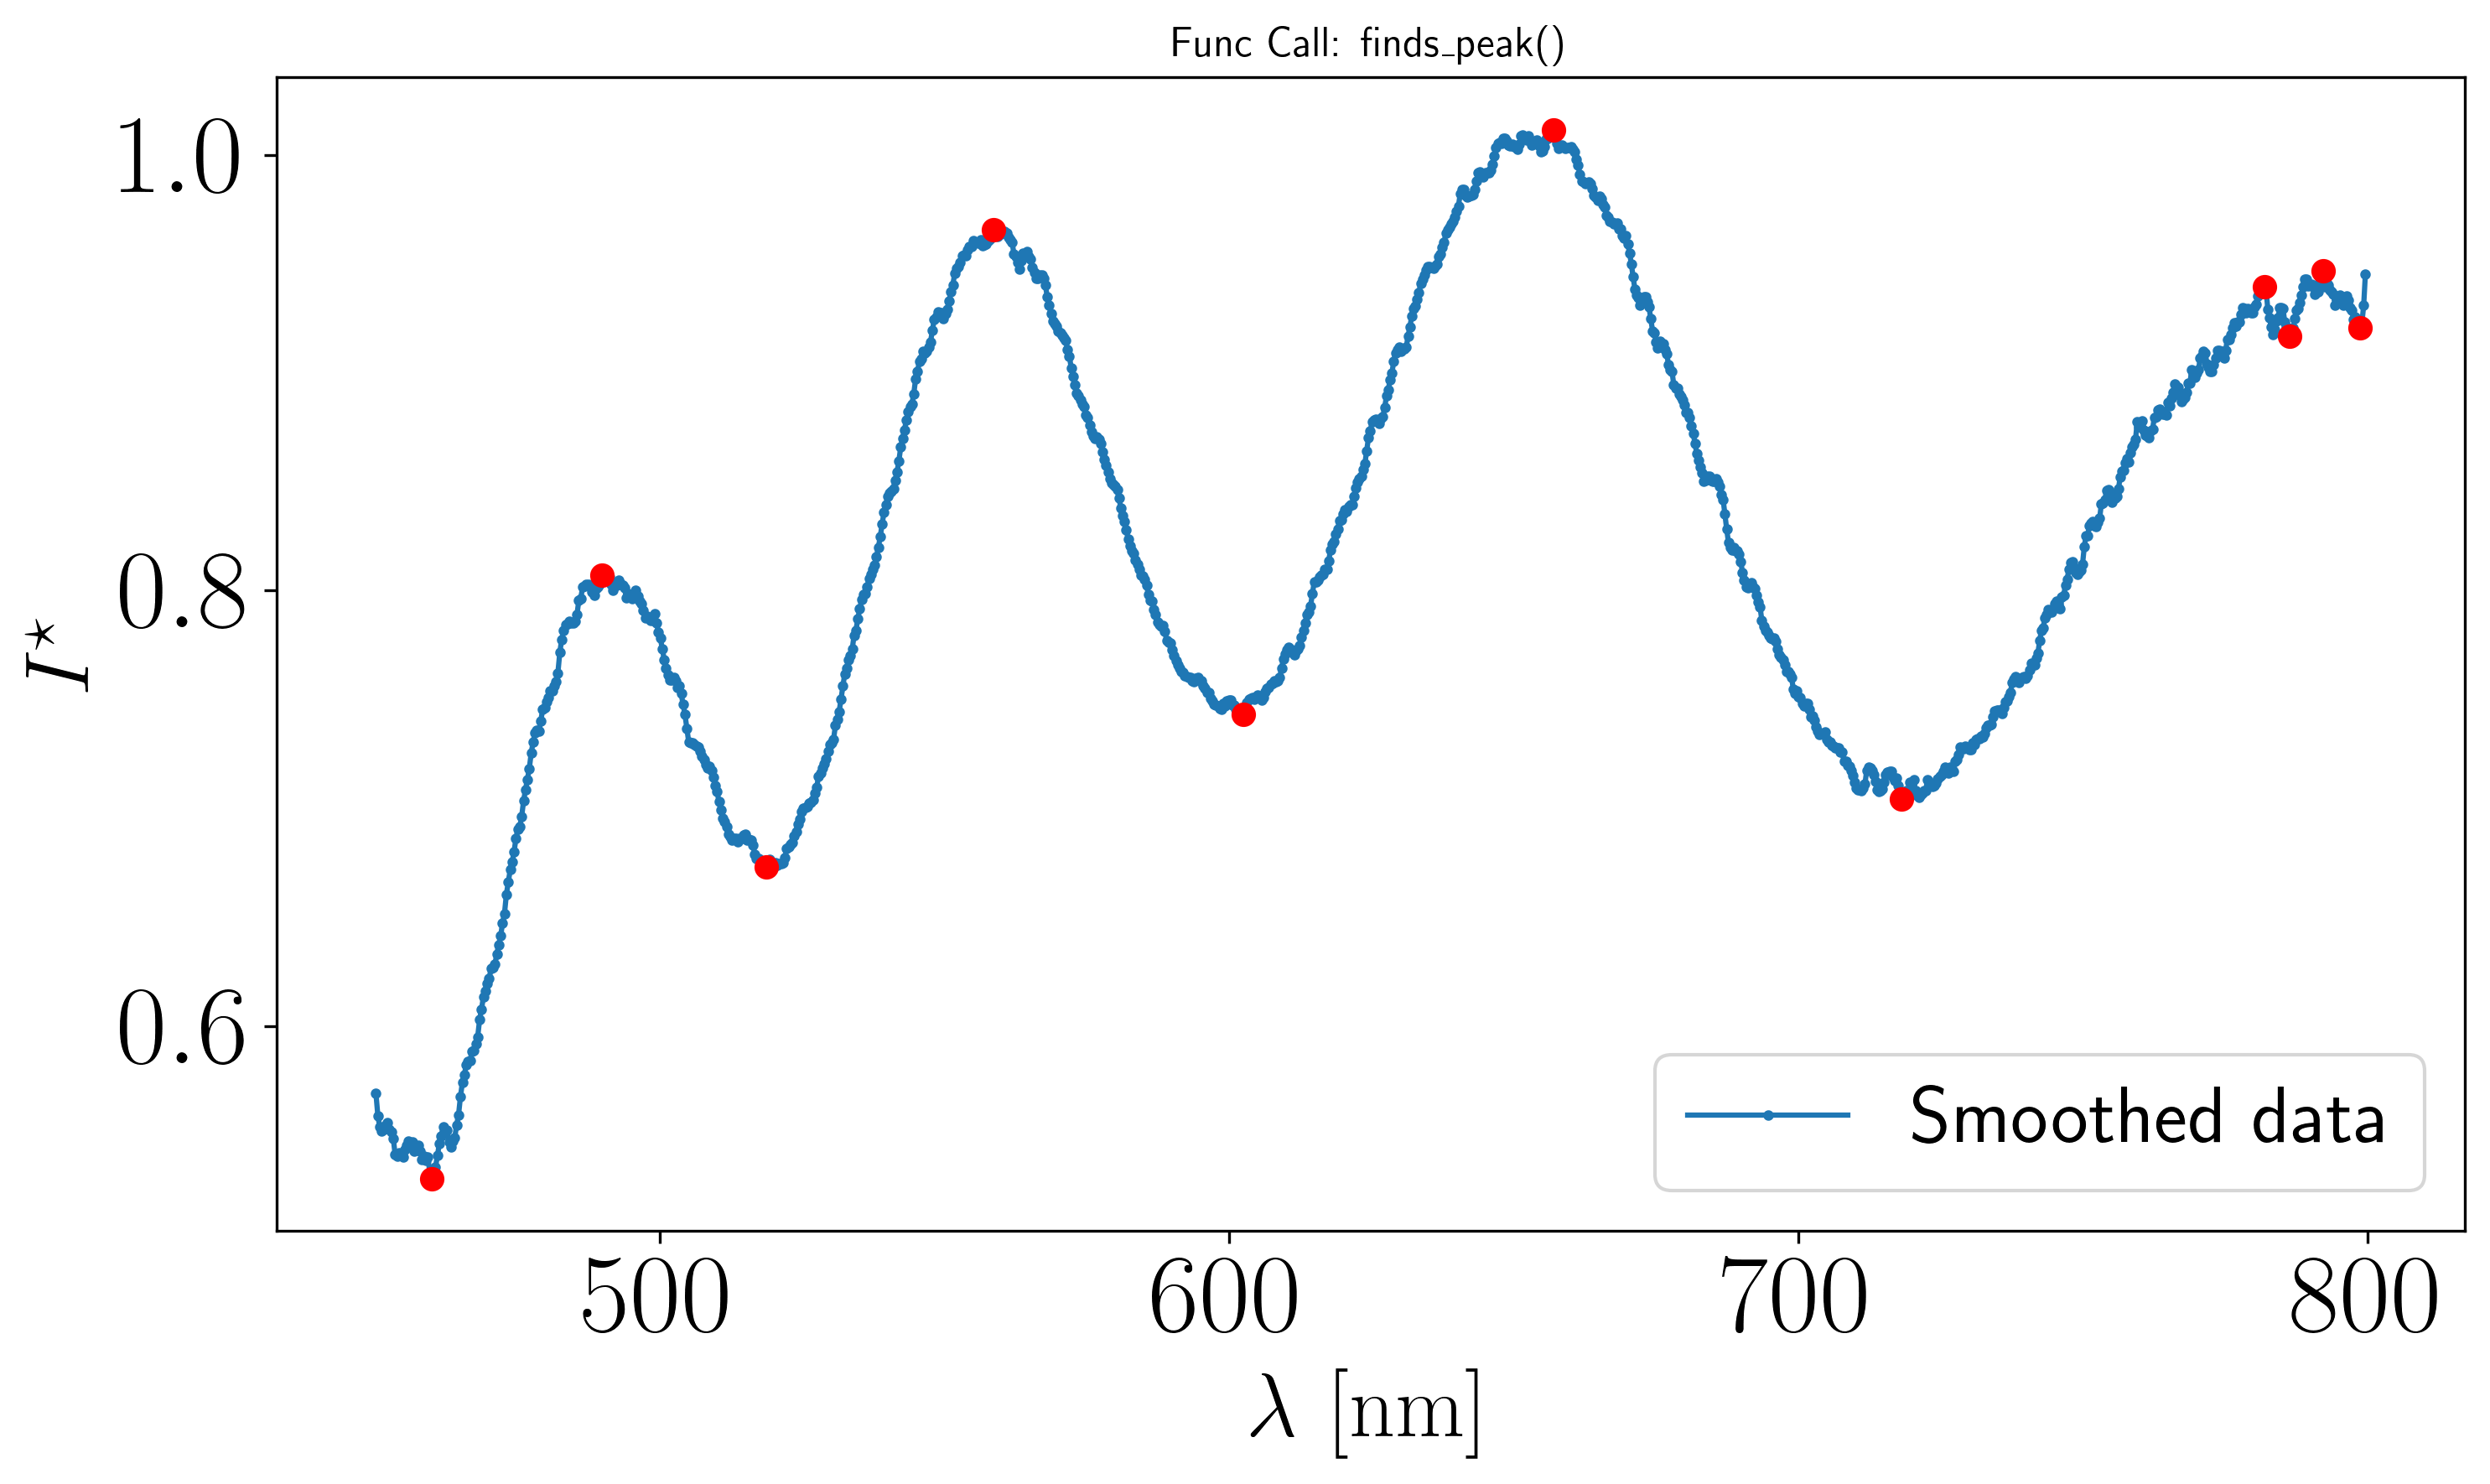
On the above figure, errors are visible on the rightmost data points. To derive the film thickness \(h\), we use the RANSAC method method='ransac' of the thickness_from_minmax function from the optifik.minmax module. Here an exemple of plot you can obtain.
[4]:
from optifik.minmax import thickness_from_minmax

# Determine the film thickness by RANSAC procedure
result = thickness_from_minmax(wavelengths,intensities_smoothed,
                              refractive_index=1.33,
                              min_peak_prominence=0.018,
                              min_peak_distance=10,
                              method='ransac',
                              plot=True)
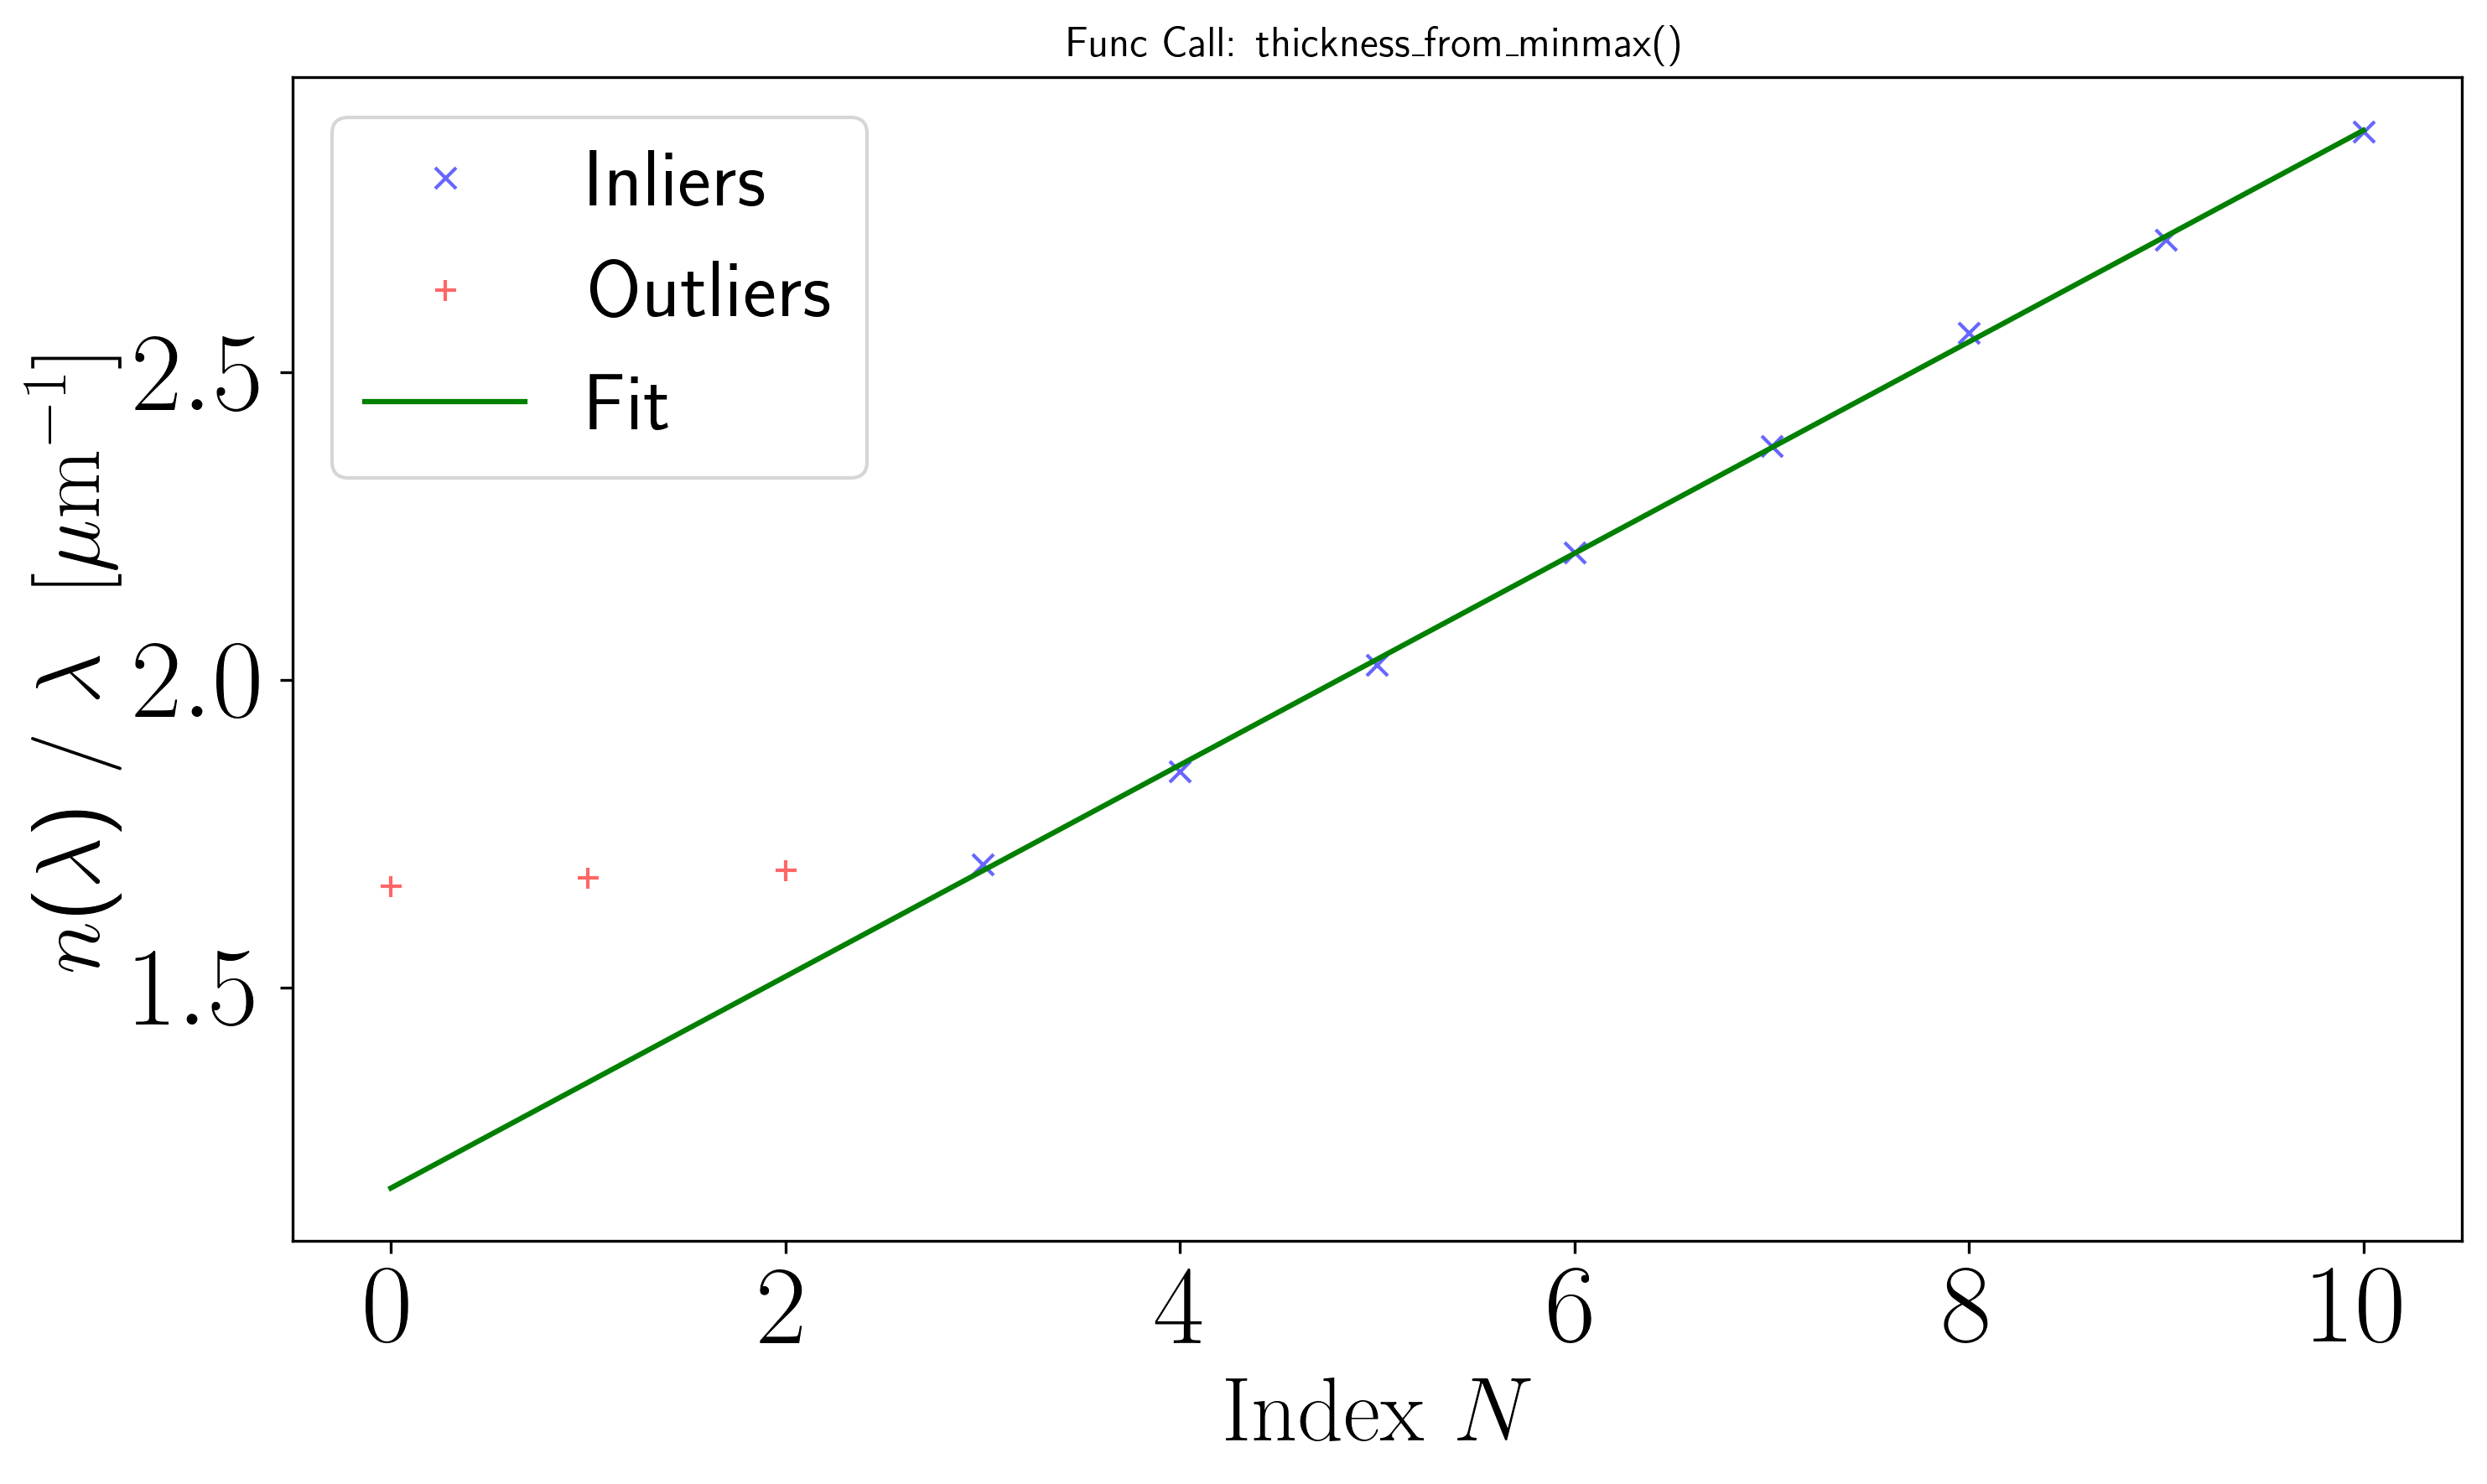
The RANSAC-based method in the thickness_from_minmax function automatically determines the film thickness \(h\).
Inspecting result shows the number of successfully detected peaks, the number of failed detections, the wavelength peak indices for both minima and maxima, and the film thickness \(h\).
[5]:
print(result)
           num_inliers: np.int64(8)
          num_outliers: np.int64(3)
             peaks_max: array([ 118,  327,  635, 1045, 1080])
             peaks_min: array([  29,  205,  463,  833, 1060, 1102])
             thickness: np.float64(1453.939036474899)
 thickness_uncertainty: np.float64(12.722770193836462)
You can specify the medium’s refractive index, the peak prominence and the minimum peak distance using the
refractive_index,min_peak_prominenceand themin_peak_distanceparameters, respectively.You can also provide a refractive index function \(n(\lambda)\) as an
refractive_indexinput.
In the following, we will see the case where the spectrum contains less than 5 peaks.